How to get the same results with factanal and psych::fa in factor analysis with R
There are two common options to run a factor analysis in R, either with the base factanal function or the fa function from the package psych. The base function factanal uses maximum likelihood estimation, while the fa function from the psych package uses minimum residual estimation as the default. Is it possible to reproduce a factanal result with the fa function? Yes, one just has to set the correct parameters.
As an example let us fit the big5 model. First, we prepare the data and libraries:
Now, we can fit the two models. factanal uses varimax rotation as default, so we also need to set this for fa.
Now let us look at the difference between the factor loadings. We round the results to three decimal points:
There is no difference, so fa can be used instead of factanal. fa is much more flexible, so I would recommend to always use it. For instance, it offers plenty of rotation options:
orthogonal:
“none”, “varimax”, “quartimax”, “bentlerT”, “equamax”, “varimin”, “geominT” and “bifactor” are orthogonal rotations.
oblique:
“Promax”, “promax”, “oblimin”, “simplimax”, “bentlerQ,”geominQ” and “biquartimin” and “cluster”
There are also many factoring options:
“minres”, “uls”, “ols”, “wls”, “gls”, “pa”, “ml”, “minchi”, “minrank”, “alpha”
With the function fa.parallel we get a parallel analysis with a plot:
options(mc.cores = 1)
pa <- fa.parallel(big5, nfactors = 5, fm = "ml")
Loading required namespace: GPArotation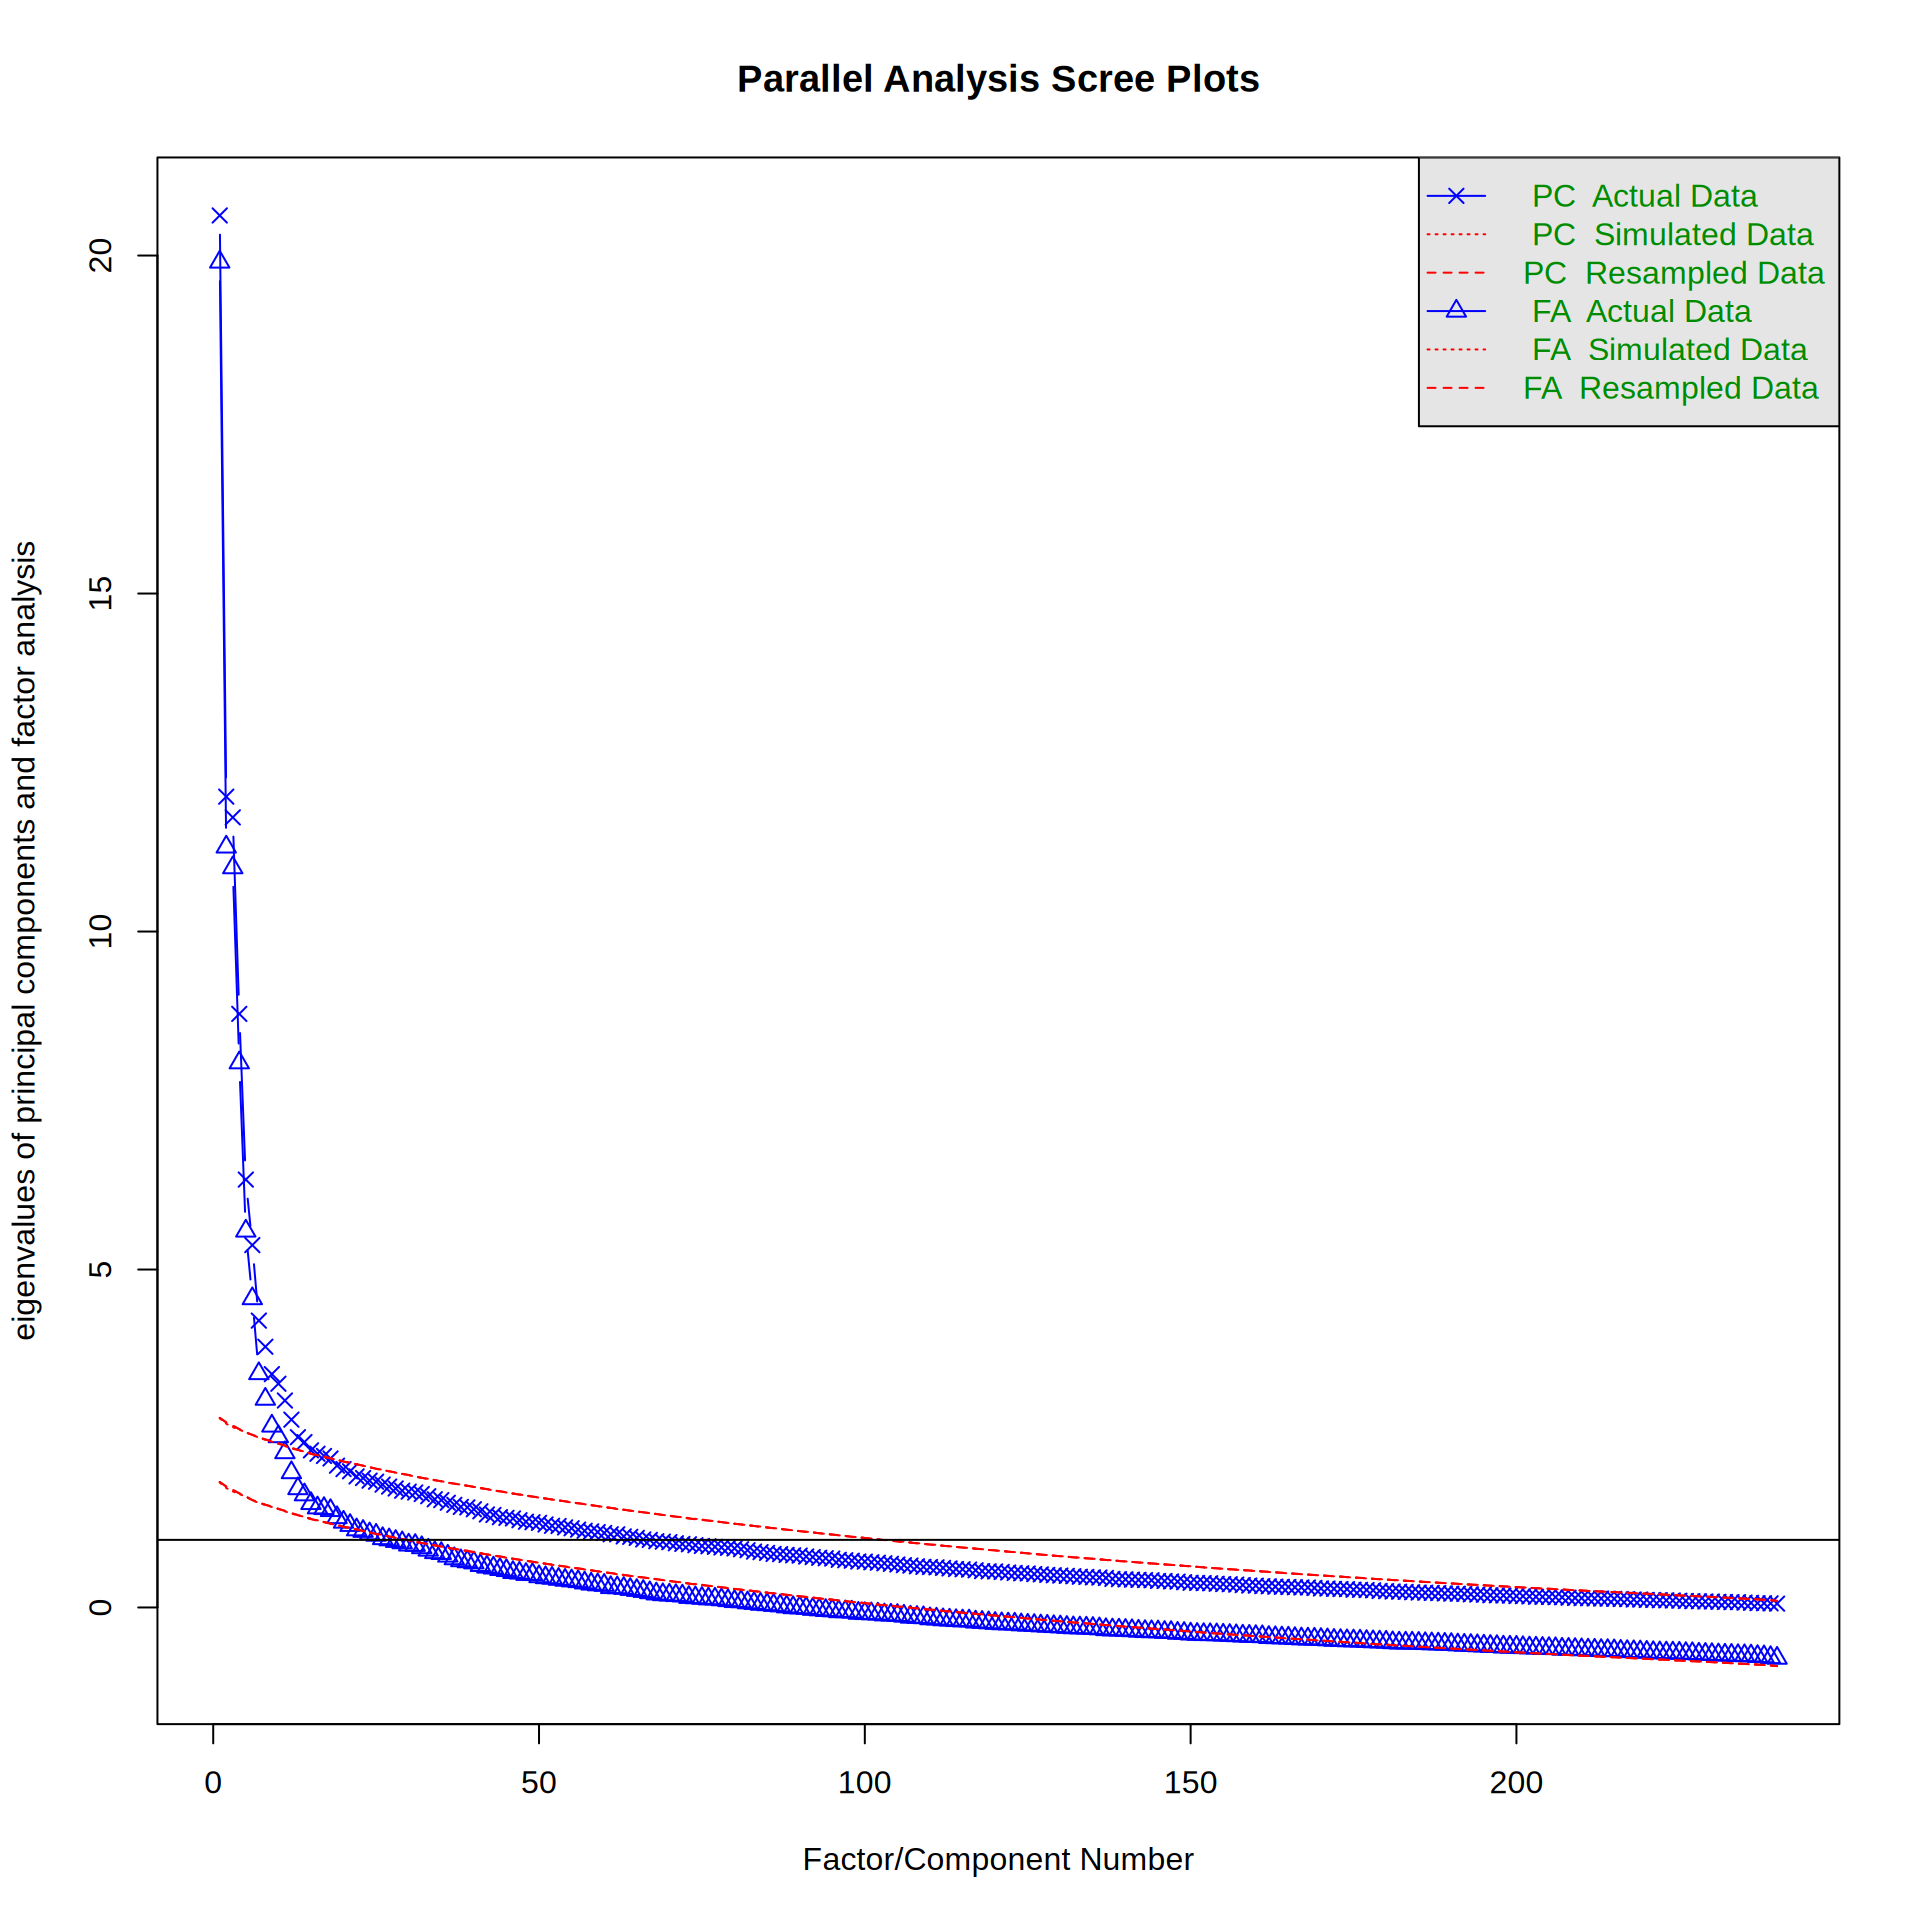
Parallel analysis suggests that the number of factors = 21 and the number of components = 15 To better see where the empirical eigen values are larger than the 95% quantile of the simulated ones, we can also make a table:
head(data.frame(pa$fa.values, pa$fa.sim), 30) pa.fa.values pa.fa.sim
1 19.9050107 1.8475501
2 11.2511343 1.7672353
3 10.9448784 1.7174755
4 8.0589502 1.6771550
5 5.5699333 1.6427853
6 4.5693196 1.5837639
7 3.4607269 1.5473746
8 3.0821743 1.5152014
9 2.6852770 1.4866457
10 2.5276525 1.4583247
11 2.2909136 1.4219373
12 1.9957009 1.3887119
13 1.7590163 1.3636369
14 1.6678141 1.3409788
15 1.5389754 1.3175907
16 1.4745543 1.2896197
17 1.4650375 1.2612930
18 1.4350744 1.2378666
19 1.3307514 1.2209192
20 1.2633818 1.1994637
21 1.2150480 1.1776725
22 1.1498082 1.1531376
23 1.1272836 1.1332935
24 1.0908419 1.1078472
25 1.0703017 1.0903334
26 1.0205069 1.0711763
27 1.0023410 1.0498557
28 0.9782625 1.0299664
29 0.9585486 1.0118915
30 0.9254454 0.9916811Quite handy. In conclusion, use psych::fa and psych::fa.parallel instead of factanal!